In the last post, we built our Minimum Viable Product (MVP) for a dashboard to give us an idea of the previous business day went. In this post, we are going to improve the accuracy of the model so that we cover all but some outlier project types. This will enable us to begin projecting our monthly revenue since those project types account for a small percentage of revenue. The more accurate model will also enable us to close our books faster each month because project managers now have reports that give them what should be included on most invoices.
Adjustments to the Data Model
In our MVP, we used the Power BI gateway to transfer data up to Power BI. In version 2, we switched to pushing data from each source up to an Azure SQL database. When we update, we are going to perform some more complex aggregations based on the data we have in our Client-Projects application, two of which will be realization and utilization. By putting it in Azure, Power BI can live query the data every time we update. By switching away from the gateway, we were able to update as often as we like.
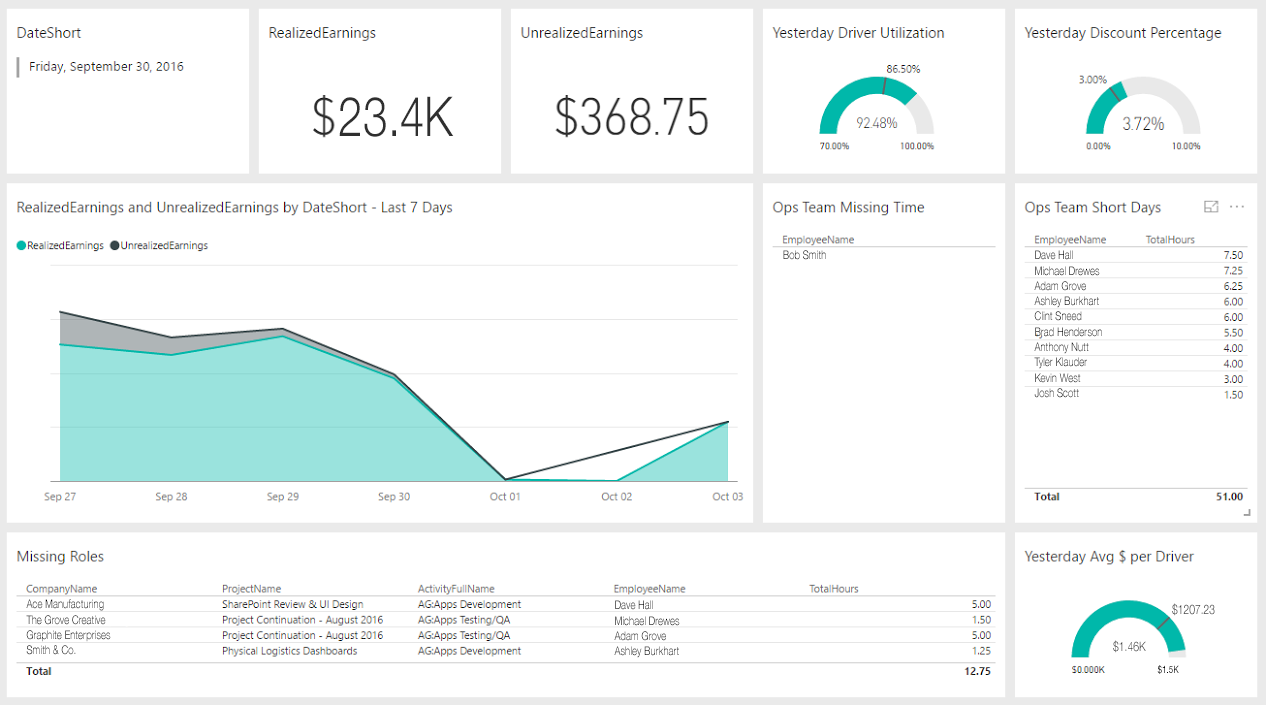
Now, we have a model that is updating more frequently, and is closer to our ideal business model. Let’s take a look at how that changes our dashboards. First, our daily operations dashboard now accurately shows total revenue for the day. Well, it does on our real dashboard. In our examples below, I made up names and numbers to protect the innocent.

As you can see, we had some unrealized earnings earlier in the week, and because it is front and center, it’s one of the first questions we ask the project managers in our daily huddle. The five day trend shows us that our corrections have had an impact. It also verifies that the time stragglers – we remind anyone in the Ops Team Missing Time or Ops Team Short Days to get their time in – have entered their time since.
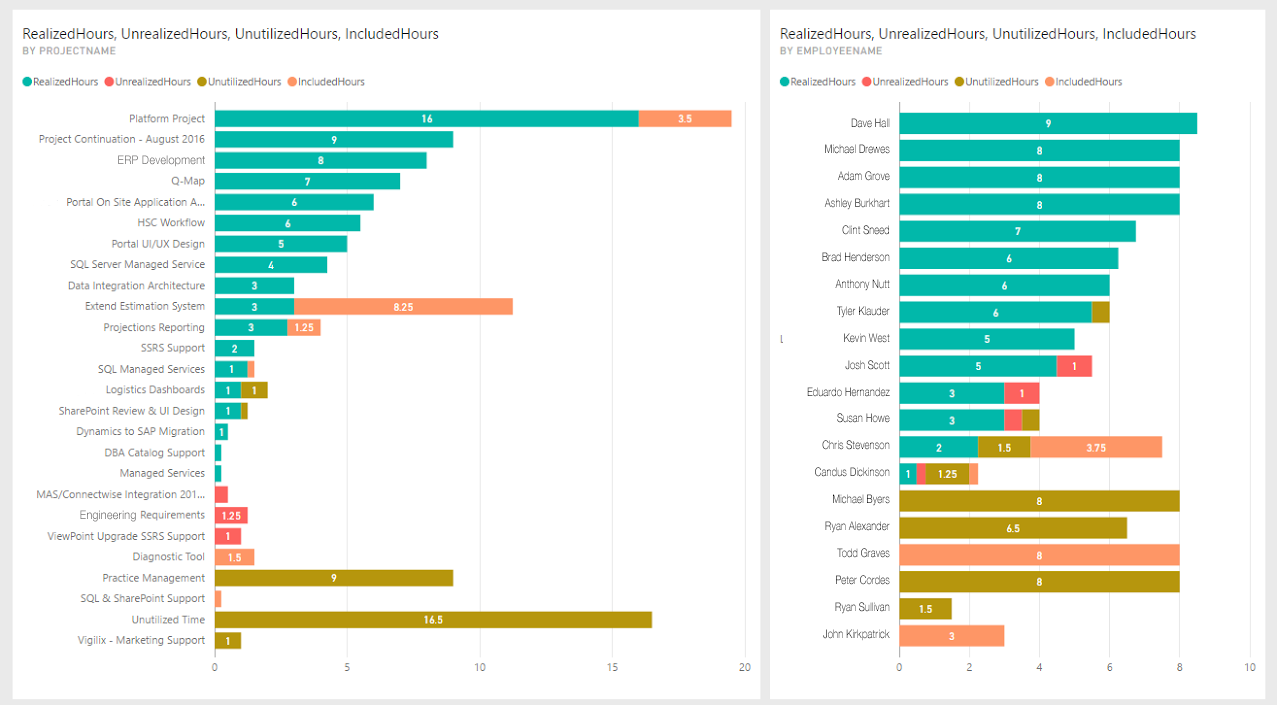
The second half of our dashboard helps us identify where problems may be occurring in our numbers above.

In our unrealized revenue example above, we can see the projects and people that accounted for those discounts. You may also notice that we added in another category of time from the previous post – Included Hours. Our standard method of billing is using a Blended Rate. That is, we only bill for driver time (Developer, Designer, etc.) and the time for Project Management and Quality Assurance is built into that rate. We do this because we feel strongly that those two roles are vital to ensure the success of the project and our clients’ satisfaction. So, on the charts above, we needed to show time that was included in the project (utilized time) but not revenue producing.
With time broken out in these four categories, we can quickly get a picture of how the day shaped up and what adjustments we might need to make. For instance:
“Shouldn’t there be more included hours in the chart on the left based on standard ratios?”
“Yes, there should, but we are missing time from an ops team member whose time is primarily Included Hours.”
“What about the one project that contains an abnormal amount of included hours?”
“Well, there was a push for a release and a spike in Quality Assurance. We had to make some underlying changes that affected most of the application, so we had to regression test more than anticipated.”
Some questions start deeper conversations (like the last one) and we schedule break out conversations for after our huddle. One of the best outcomes of creating the dashboard and reviewing it daily is pulling the conversations about topics as close to the actual event as possible.
Projected Monthly Earnings
The last adjustment to our dashboard was adding a projected monthly earnings. In our MVP dashboard, we were going for an idea of yesterday. Our numbers were off just enough that over the course of a month, the compounded variance made the projection unreliable. Now, we have a model that we actually use to do most of our invoicing, so we have a great basis for the completed days of the month. We just need to come up with a mechanism to project the remaining days for the month.
Coincidently, we are already using a generic calculation in our monthly forecasts that we could apply at the daily level. We simply add the Realized Earnings and use the Remaining business days instead of total business days.
Monthly Projection = Realized Earnings for the Month + (Estimated Daily Rate * Remaining Business Days of Month)
Obviously, we are hiding most of the magic is in the Estimated Daily Rate. After we submit our financial projection to the president for the month, we save some key numbers that derive the projection in a spreadsheet on OneDrive. Power BI can then pick those up and combine them with the data in our Azure SQL Database to give us our projection.
Estimated Daily Rate = Average Driver Bill Rate * (1 – PTO % – Unutilized Time %) * # of Drivers + Estimated Non-Driver Contributions + Estimated Contractor Earnings
Since we are using the exact same formula as our financial projections, we know every day how we compare. Could we be more accurate with our Estimated Daily Rate? Absolutely, and we will once we have a more detailed projection backlog.
Effects
What effects did this version have on our business? Well, we have a fairly accurate picture of revenue at any given time. In Lean terms, this has reduced our batch size, so we can make adjustments quicker and maximize the work our talented team does. We aren’t waiting until the end of the month to find out that there someone began spending unrealized time on a project. The new version also helped our CEO, Andrew Kurtz, more quickly understand what is going on within the business even if he isn’t involved in every project and get to the ‘Why’ questions faster. We can think strategically how to handle situations as a team rather than spending the time understanding what is happening.
Next Steps
With an accurate model in place for the daily dashboard, we are set to move on to additional analysis that completely aligns our business with our targets. What trends should we identify and correct? What ratios are important to keep? What leading indicators can we add?
We also need to spread information throughout the business, not just the team involved in the daily huddle. This will enable everyone to make positive adjustments by empowering them to make more decisions on their own.


