Originally published April 1, 2021 and updated January 16, 2024
A little less than a year ago, we took on a Power BI project internally, the results of which we just published in a case study. Our goal was and is to accurately measure our business head to toe, but we weren’t out to solve the entire challenge in one fell swoop. We practice what we preach with regard to Agile, so we started with a small experiment to see if it changed our behavior. Our Minimum Viable Product was How Did We Do Yesterday.
Just like many of our clients, we did not start from scratch. Also, like many of our clients, we had assigned one employee the task of putting together a data warehouse and reports, in addition to his normal workflow, so that we were ready to pull information about specific projects. That information was sourced from our custom Time Tracking system, our custom Job Tracking system, and QuickBooks (Did we mention we write custom software?). Since this was an MVP, we went with the information we had at our disposal:
- Time Entries Associated to Projects, Employees, Activities and Dates. The amount of time we worked.
- Activities: Categorize the time we enter.
- Projects: Associated to Clients
- Clients
- Roles: Associated to Projects and (Activities or Employees). This applies a rate to the time we work.
We also had a few reports that were already helpful in identifying problems whose data we wanted to surface quicker. Since it was a key piece of understanding how we performed the previous business day, we added them as well.
- Missing Time from Last Business Day
- Missing Roles for Entered Time
- Duplicated Roles for Entered Time
How did we decide what metrics to measure?
There are many types of performance metrics that can be tracked and measured, depending on the specific context. For example, metrics could include sales figures, customer satisfaction ratings, or project completion rates. Understanding these metrics can provide valuable insights into one’s performance.
Just counting the number of pieces produced daily may not be as valuable without context elements like: the time of day produced, the people producing the product, how long each piece took to produce, the number of people producing, etc.
Careful analysis of your business and identifying the metrics that determine the success of your business or business unit is crucial. These metrics should provide actionable feedback – information that identifies that action is needed in a specific area. A prime example is a phone contact center: a key metric that defines the performance for an employee is the average length of time a contact agent is on the phone call. This is the key metric to the success of a contact center’s ability to handle the call volume. As this value fluctuates, the resulting actions could be the following possibilities:
- Analyzing the call types or documented responses to ascertain if additional training is needed
- Analyzing the seniority of the workforce to determine if a maturing is needed
- Analyzing the quality of work by comparing survey results or call quality monitoring results to determine if these metrics are suffering due to lower call times
What determined if we had a good day?
For our MVP, we chose to focus on operations, selecting revenue as the key metric. We have been following the guidelines in Scaling Up, so we intended to look at this every day. That meant the first question we asked every day was Why? Therefore, we populated the remainder of the dashboard with key reasons why we earned the revenue that Power BI displayed.
- How many hours did everyone enter, and what were their billable and unbillable totals?
- Is anyone missing time completely (Time Bandits)?
- How much did each individual earn? (Note: this was not a performance indicator as our developers aren’t in control of the rates for their projects)
- Are we missing any roles that would prevent revenue from being recognized?
- Do we have any duplicate roles that would inflate the revenue recognized?
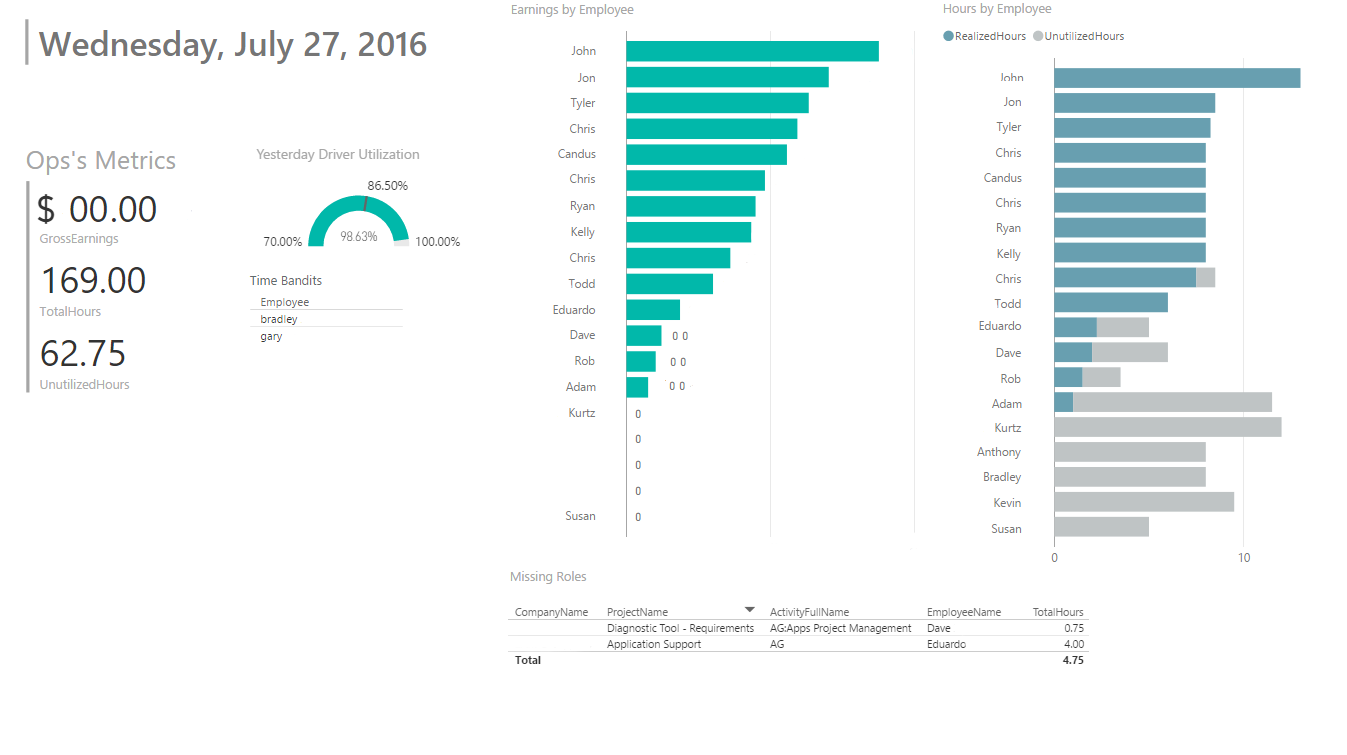
This simple dashboard essentially replaced a four-page report we pulled each day going into our daily leadership huddle. The reports remained for one main reason—as an MVP our synchronization with Power BI happened eight times a day, the limit for the Personal Gateway. We timed the sync with our huddle, and any stragglers would be picked up by later syncs.
Now, we could see a decent snapshot of operations with enough details to understand both how we did and why. Even better, we could pull it up anywhere. We had a tool that was going to start changing all of our behavior for the better.
How can you decide what tools and technologies are right to measure your performance?
Key to being able to access these insights is a platform that will support your vision, data consumption or culture goals, and provide the features needed to provide the feedback or forecasting needed to manage your business.
These technologies would include data storage solutions, image repositories, integration technologies, and reporting toolsets.
Although we could write an entire blog about what goes into choosing a toolset that is best for an organization, some of the keys that should be considered are:
- Technology stack supportive – use technology that supports your primary source systems. Many times, unnecessary effort and money is spent trying to fit a flashy solution with an unsupported infrastructure. Take time to make sure that the “handshake” among the selected technologies is as natural as possible.
- Ease of use and support – adoption by both your support team as well as the consumers of the data is vital. The last thing any business wants to see is a solution that promises so much value, but no one uses. Lack of adoption could be due to lack of training, perceived value, executive support, or even the inability to support the solution with updates and fixes.
- Versatile feature sets – every new technology will require some adjustment. However, try to minimize the disruption by selecting technology that will support your source systems, your desired reporting culture, or the modernization of your toolset. This could include cloud-based infrastructure, self-service reporting, enabling citizen-developed application for data collection and management, or data governance and security.
While there are countless number of variables to consider, ultimately choosing a suite of technologies is unique to your organization’s goals and data footprint.
What didn’t we have in our model?
While this dashboard described the basics, we were still missing a few standard metrics for professional service firms. One measurement occurs rarely but is absolutely critical to bubble up immediately when it does occur—unrealized time. Unfortunately, whether time is realizable or not is not an attribute that the time tracking system puts on the time entries. That information cannot, or rather shouldn’t, be stored at the transaction (time entry) level because it can be influenced by other time entries.
Also, thinking back, our end goal was to measure (and later forecast) the health of our organization. In order to do this, we needed to analyze trends in the data we have already captured as well as bring in other data sources that measure other areas of our business like Marketing and Sales. Once we are confident that we are sufficiently measuring what is behind us, we can start to turn our attention towards what is in front.
Why analyze performance data?
While we naturally have a feeling about our performance, this data can be leveraged to validate that feeling with tangible evidence. Many times, our assumptions or biases can lead us to a false sense of security in our understanding and to making poor decisions. Data-driven insights can provide the needed validation to prove or disprove those assumptions, even providing the information needed to avoid upcoming issues that will unnecessarily challenge the success of the organization or goal. These insights could be comparing our performance over time or certain segments of our business. They could expose unknown seasonality that could be leveraged to meet the sales objectives.
Providing this feedback from the data collected is vital in avoiding missed opportunities, ineffective decision making, as well as helping to establish financial stability.
How can I set goals that effectively track my performance?
As you begin collecting and presenting data, the sheer amount of data can be overwhelming and leave you paralyzed by trying to understand it all or the potency of your key objectives diluted leaving your analysts and staff wondering “what is truly important?”.
Not all data is relevant or important. Keeping your data collection and reporting relevant streamlines your ability to see important trends or benchmarks and take decisive action.
Once you’ve identified the solution stack and started tracking the key data and metrics, the next key variable in the journey is to define goals or thresholds that provides enough insight to act.
A common acronym used to describe a valuable goal is S.M.A.R.T. (Specific, Measurable, Achievable, Relevant, Time-bound). Many times, an organization knows what it takes to run an efficient and productive/profitable business. Whether or not they exist, goals should be intentionally defined or critically justified to meet an organization’s objectives.
Using S.M.A.R.T. goals, overlaying them with the actual performance metrics, provides the insight needed to adjust performance, plan for the future, and reward success.
How can analyzing performance benefit my organization beyond measuring progress?
As your organization matures in a data-driven culture, you will see innovative responses to challenges that are presented. Many organizations develop a self-service data culture using technologies that allow data consumers to ask questions of the collected data to highlight trends in both challenges and opportunities. These allow those that are on the front line to get extremely timely answers to questions about their daily routines or responsibilities.
As stated previously, having collected your organization’s data over time provides insights that can expose seasonal or categorical trends that expose opportunities previously assumed or overlooked.
In conclusion, to answer the question “how did I do yesterday?” can be an overwhelming task. Start small and build up. A good technology will make room for you to scale and adjust as your business grows or your needs change.
- Identify key metrics that define the success of your business
- Select a data collection and reporting solution that compliments your data footprint and vision
- Use S.M.A.R.T. goals to measure success and areas where adjustments are needed
- Analyze insights from your data for challenges or overlooked challenges