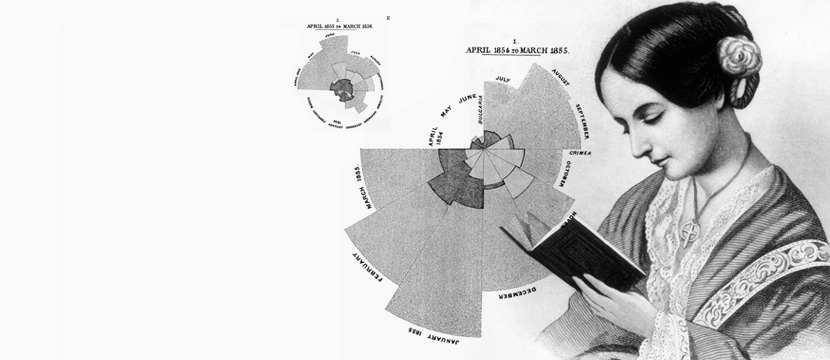
Florence Nightingale, Pie Charts and the Birth of Business Intelligence
Did you know that the actual pioneer of Business Intelligence was a nurse? Florence Nightingale is best known for revolutionizing the field of nursing and instigating widespread hospital reforms, but her methodology looks a lot like the cutting-edge business strategies of today.
During the Crimean War, the death toll extended far beyond the battlefield. Mortality rates in Army hospitals were rapidly increasing even among soldiers admitted with minor wounds. The medical system desperately needed modernization and reform, but the doctors in Army hospitals were too busy treating the sick and wounded to step back and understand the core problems at hand.
In 1854, British Parliament sent Florence Nightingale along with 38 nurses to Crimean war hospitals to assist in wounded patients’ care. Nightingale came to believe that poor sanitation contributed to the high death rates in Army hospitals, but she needed to prove it.
The process Nightingale began in Army hospitals prefigured present-day Business Intelligence in the way that it accumulated, visualized, and communicated data to radically change outcomes.
1) Collecting and centralizing of data
Nightingale knew that even seemingly insignificant factors could affect the spread of disease among the wounded. To her, no piece of data was too insignificant to contribute to the larger issue of the increasing death rate. She kept meticulous records detailing the size of the rooms where soldiers were housed, the amount of ventilation and sunlight these rooms received, and even the distance between the kitchens where the soldiers’ food was prepared and the sick areas.
She brought the data together so that doctors and statisticians could analyze the problem as a whole and extrapolate actionable insights. Factors formerly ignored became part of problem solvers’ critical lens. Nightingale’s work demonstrated the value of data-informed, data-driven insights gathered at the ground level in making high-level, transformative change.
2) Data visualization reveals the core problem.
Nightingale had to go farther than gathering data to bring change to the hospitals. She had to envision data in a completely new way. Like many present-day businesses, she realized that change-makers may have been fighting the right battle all along, just on the wrong battlefield.
The data brought back from Army war hospitals in Crimea fueled years of study for Nightingale and the statisticians who made up her team. The next step in solving the larger problem required coming to a better understanding of the core issues. To do this, she rejected the long-standing one-dimension method of conveying data for a deeper, multi-dimensional visualization: pie charts.
By visualizing the data in this way, Nightingale was able to quantify the impact of small changes and effectively answer questions that politicians never thought to ask.
Although Nightingale wasn’t the first person to use data visualization, she was the first to popularize it. She knew that in order to convince stakeholders there was a need to change, she would need to convey her complex findings in an innovative and easy-to-grasp way. She was right.
3) Data collection and data visualization leads to cultural transformation.
The real change required in Victorian England was a radical shift in perception. Nightingale’s data collection and visualization crystallized the problem and forced decision-makers out of their old ways of thinking.
The data revealed the larger issues and convinced policy-makers of the day—not known for quick progress—to make rapid, radical change in the Army hospital systems. Nightingale’s research convinced stakeholders that her theories were more than just theories and that change was critical.
Her recommendations for hospital reform were concrete and specific. Caregivers rallied behind the new standards and guidelines she suggested and the result was a complete transformation in military hospital care.
4) Results: Exceeded expectations.
After a decade of sanitary reforms, the mortality rate of British soldiers in Indian hospitals dropped 75%. Nightingale and her team’s work affected thousands of lives and changed the way that leadership approached seemingly unsolvable problems.
Like Nightingale’s work, Business Intelligence is more than a one-time solution. It’s a radical new way of thinking. Whether you’re running a business or seeking, like Nightingale, to find answers to medical mysteries hidden in data—Business Intelligence can identify the problem, collect data around the processes and systems that support the problem, and create visualizations that reveal the problem’s source. All of this translates into actionable insight that can be used to solve the problem, transform your organization’s culture, and lead to new opportunities and long-term growth.
Andrew Kurtz is the president of Kopis (formerly ProActive Technology), which has been serving Greenville, SC with custom software development solutions since 1999. Andy and his team are experts in business intelligence, custom software development, database administration, mobile app development, and much more.
References:
McDonald, Lynn. “Florence Nightingale, statistics and the Crimean War. Journal Of The Royal Statistical Society: Series A (Statistics In Society) 177, no. 3 (June 2014): 569-586. Business Source Alumni Edition, EBSCOhost (accessed March 10, 2016).
Wuithiran, Rosrin. “THE ORIGIN OF GRAPHS AND CHARTS.” History Magazine 13, no. 1 (October 2011): 6-7. History Reference Center, EBSCOhost (accessed March 10, 2016).
Brasseur, Lee. “Florence Nightingale’s Visual Rhetoric in the Rose Diagrams.” Technical Communication Quarterly 14, no. 2 (Spring2005 2005): 161-182. Education Research Complete, EBSCOhost (accessed March 10, 2016).
Conway, Anne-Marie. “LADY WITH THE DIAGRAM.” Eye (0960779X) 21, no. 82 (Winter2011 2011): 29. Art & Architecture Complete, EBSCOhost (accessed March 10, 2016).
Nightingale, Florence, and Lynn McDonald. Florence Nightingale and Hospital Reform. Waterloo, Ontario, Canada: Wilfrid Laurier University Press, 2012. eBook Collection (EBSCOhost), EBSCOhost (accessed March 10, 2016).


